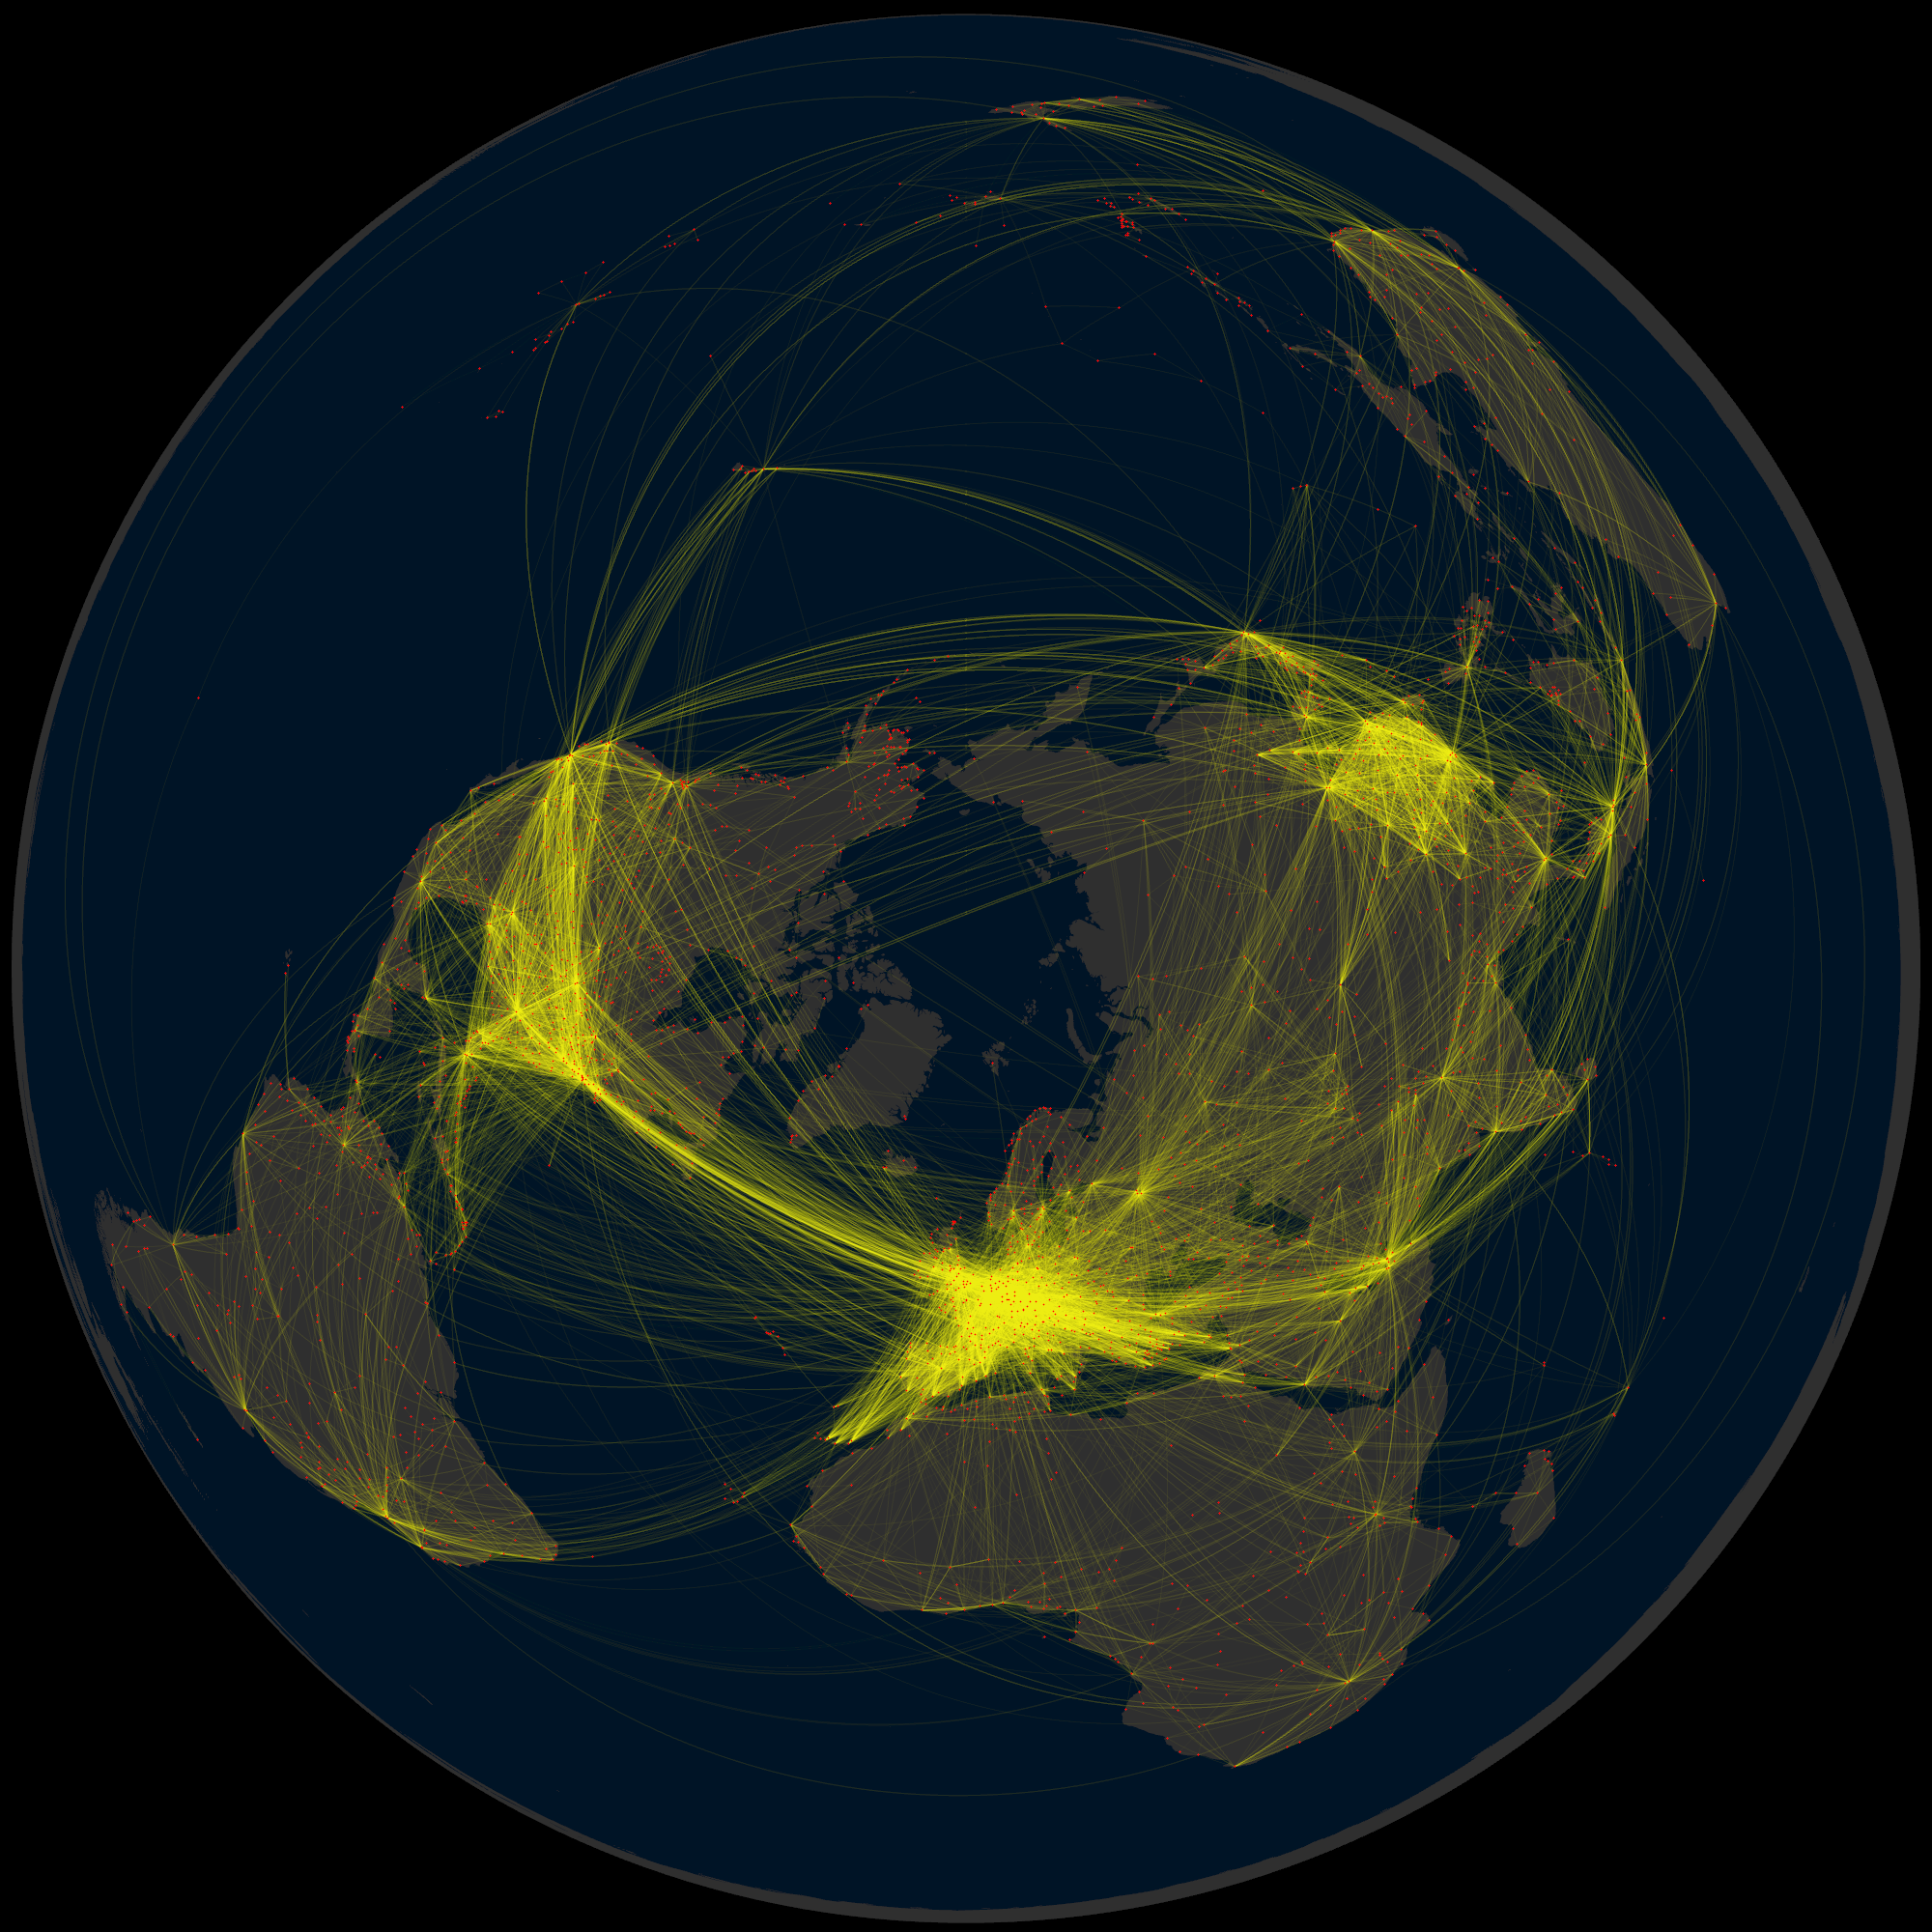
The closure of Niger’s airspace earlier this month has further narrowed the corridors available to airline operations. On 7th August 2023, the military junta in Niger announced the closure, citing the possibility of military intervention from neighbouring states. As the closure happened without warning, dozens of aircraft had to be rerouted around the closed airspace.
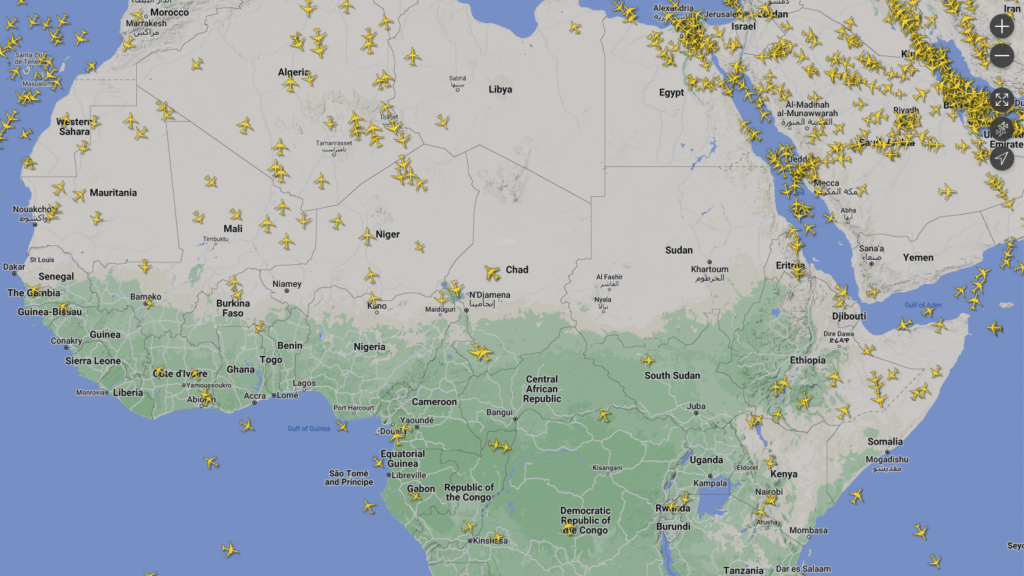
Figure 1. Flight paths over Central Africa at 00:26 on 5th August 2023
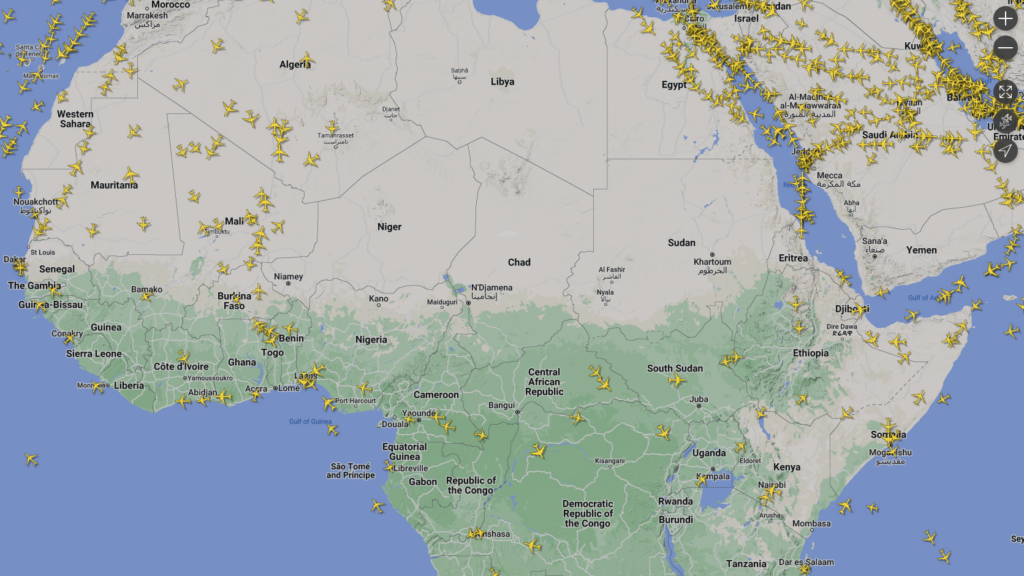
Figure 2. Flight paths over Central Africa at 00:26 on 7th August 2023
This rerouting of flights caused disruption to many airlines:
British Airways flight BA64 from Nairobi to Heathrow was forced to turn round and return to Nairobi due to insufficient fuel to cope with the diversion.
Air Belgium flight MD50 from Madagascar to Paris had to return to Madagascar
Brussel Airlines flight SN383 from Cameroon to Brussels made an additional stop in Barcelona
Two British Airways A380 on the Johannesburg / Heathrow route had to turn back after 5 and 4 hours respectively. In comparison, the Virgin Atlantic flight on the same route completed the 10-hour flight in only an additional 36 minutes.
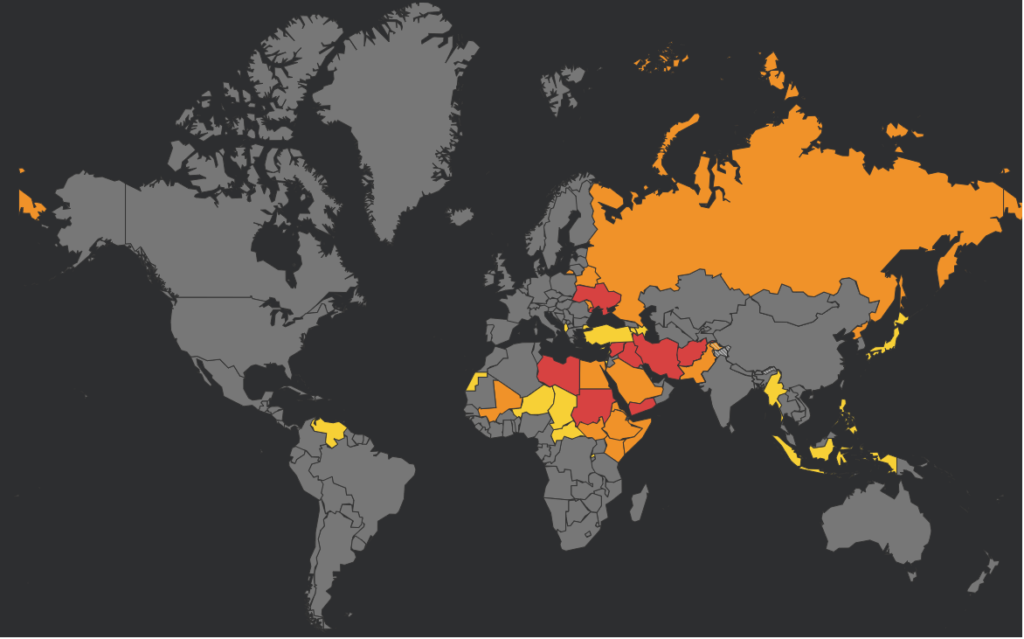
Together with Sudanese and Libyan airspace closures the closure has resulted in a 2,500 wide no fly zone across the widest part of Africa. SafeAir has plotted those regions which are currently no-fly or restricted operations zones. The impact on airline operations is that they will have to create new flight plans that may add thousands of kilometres to some routes.
Figure 3. SafeAir world map showing closed or restricted airspace
France’s BFM in Aerotime HUB estimate that this erratic unplanned closure of airspace will directly result in flights taking 15 minutes to 2 hours longer.
Impact on operations
It is not just the fuel in the aircraft that is the limiting factor. Humans also have their constraints in terms of the number of hours that they can work without reducing their sleep reservoir to an unacceptable level, resulting in excessive fatigue.
Biomathematical Models (BMMs) of fatigue are used by many airlines to check that rosters have not resulted in high fatigue levels and that trends month-to-month and year-to-year are improving. Planned rosters are run through the BMMs enabling predicted fatigue to be calculated based on variables including duty duration, workload, sectors flown and sleep periods. BMMs are also used for post-event analysis to understand the contribution of fatigue to an incident and enable learning to be incorporated into operations.
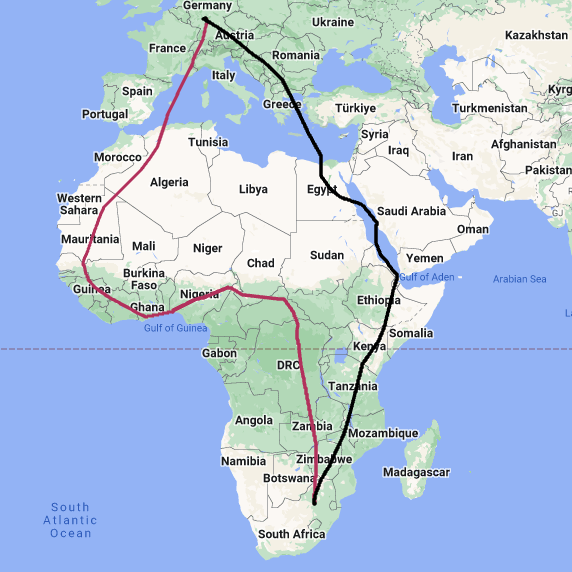
Figure 4. LH573 planned route (black) and actual route (red)
Closing Airspace: the effect on fatigue
Lufthansa flight LH573 from Johannesburg to Frankfurt was severely impacted by the closure of the Niger airspace. The flight was diverted to Lagos, Nigeria for refuelling, waiting Lagos for around 2 hours before finally arriving at Frankfurt 7 hours behind schedule. This extended and unplanned duty extension will have had a significant impact on crew fatigue.
Modelling the impact
Our SAFE model, developed for the UKCAA and in use by them since 1994, allows for the evaluation of “what if” scenarios and post incident analysis to evaluate and quantify the effects on crew fatigue. Alongside standard duty characteristics of duty time, time zone changes and number of sectors flown, SAFE also incorporates a variable workload function to cope with the increased stress associated with factor such as recalculating routes and landing at unfamiliar airports.
We have undertaken a comparative analysis of the usual LH573 route and duty times and the impact of the closed airspace on the diversion to Lagos using the SAFE model. In both cases, the outbound flight has been included in the analysis to account for cumulative fatigue.
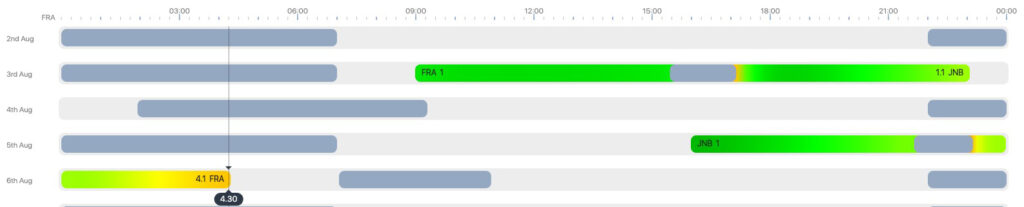
SAFE has estimated the likely sleep periods (grey areas) based on an extensive database of actual sleep patterns from flight crew. The single sector flight provides opportunity for the flight crew to achieve meaningful and timely in-flight rest.
Figure 5. SAFE analysis of LH573 duty on 6th August 2023
Using the validated Samn Perelli scale for fatigue, the maximum fatigue during this duty period is 4.30 (between a little tired, less than fresh and moderately tired, let down), or 5.57 on the Karolinska Sleepiness Scale.
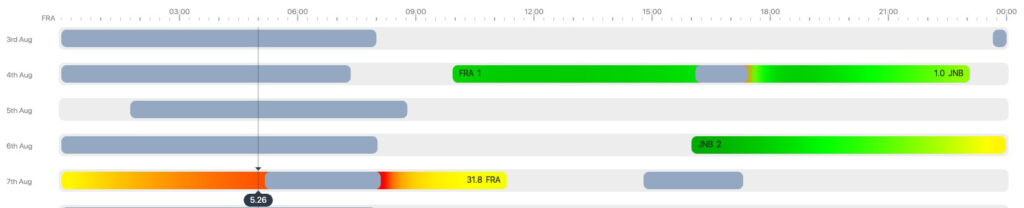
In comparison, the modified LH573 route has a significantly greater impact on fatigue.
Figure 5. SAFE analysis of (rerouted) LH573 duty on 7th August 2023
The additional workload caused by a second sector and rerouting the aircraft has led to a higher level of fatigue that peaks after take-off after the second sector. The fatigue effect is compounded as the typical period of in-flight rest (shown in Figure 4.) is not possible due to the diverted landing at Lagos and time on the ground. Consequently, the maximum fatigue, using the SP scale, is 5.26 (between moderately tired, let down and extremely tired, very difficult to concentrate), or 6.95 on the Karolinska Sleepiness Scale. This fatigue score is in excess of limits that FRMSc would recommend without a review by Flight Safety operations.
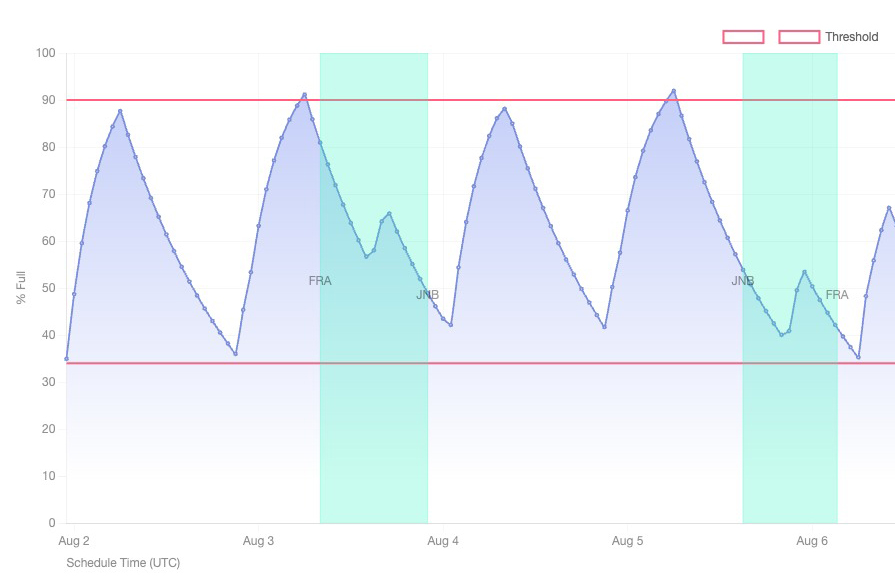
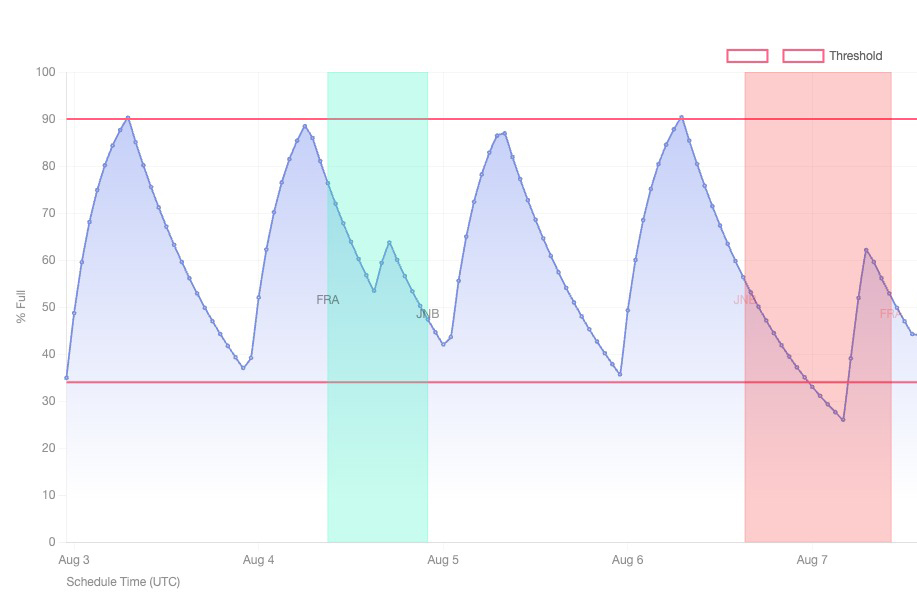
The capabilities of SAFE (and its sister model CARE, for Cabin Crew) enable these “what if” scenarios to be modelled easily and in real time so that sudden changes such as those caused by the closure of air space can be understood. Mitigation actions such as adding extra crew members or providing rest facilities on board can be easily evaluated as well as whether the sleep reservoirs (Process S) of the crew are sufficient to complete the journey. In the figure below, it can be seen that the sleep reservoir in the rerouted LH573 flight has dropped significantly below the threshold that will mean high levels of sleep pressure for the pilots.
Figure 6. Sleep reservoir calculation for planned LH573
Figure 7. Sleep reservoir calculation for rerouted LH573
How can our models help?
Our SAFE and CARE models are used across the world but operators, regulators and unions to prospectively and retrospectively assess fatigue risk in aircrew.
Our models allow for real-time recalculation of the effect of operations on fatigue and allow for safety and planning departments to make informed decisions on operational changes and restrictions that include the human factors as well as the aircraft aspects. These effects are evident in the closure of airspace but also the Air Traffic Control failures in the UK.
To find out more about our suite of fatigue models and to request a demonstration contact us at https://www.frmsc.com/contact/
Meet Dr Barbara Stone
Science Director at FRMSc
Dr. Barbara Stone has an extensive career spanning over 40 years in the scientific community. Before co-founding FRMSc, she was a QinetiQ Fellow and the Technical Manager for…
Effective fatigue management techniques in aviation can serve as a valuable model for maintaining vigilance and ensuring patient safety in healthcare. By collaborating and communicating efficiently, we can proactively mitigate errors and raise caregiving standards with confidence.
The recent Batik Air flight that veered off course due to both pilots falling asleep provides a reminder as to the role that personal lives have on fatigue.
We use technologies like cookies to store and/or access device information. We do this to improve browsing experience and to show (non-) personalized ads. Consenting to these technologies will allow us to process data such as browsing behavior or unique IDs on this site. Not consenting or withdrawing consent, may adversely affect certain features and functions.
Functional
Always active
The technical storage or access is strictly necessary for the legitimate purpose of enabling the use of a specific service explicitly requested by the subscriber or user, or for the sole purpose of carrying out the transmission of a communication over an electronic communications network.
Preferences
The technical storage or access is necessary for the legitimate purpose of storing preferences that are not requested by the subscriber or user.
Statistics
The technical storage or access that is used exclusively for statistical purposes.The technical storage or access that is used exclusively for anonymous statistical purposes. Without a subpoena, voluntary compliance on the part of your Internet Service Provider, or additional records from a third party, information stored or retrieved for this purpose alone cannot usually be used to identify you.
Marketing
The technical storage or access is required to create user profiles to send advertising, or to track the user on a website or across several websites for similar marketing purposes.
To provide the best experiences, we use technologies like cookies to store and/or access device information. Consenting to these technologies will allow us to process data such as browsing behaviour or unique IDs on this site. Not consenting or withdrawing consent, may adversely affect certain features and functions.
Functional
Always active
The technical storage or access is strictly necessary for the legitimate purpose of enabling the use of a specific service explicitly requested by the subscriber or user, or for the sole purpose of carrying out the transmission of a communication over an electronic communications network.
Preferences
The technical storage or access is necessary for the legitimate purpose of storing preferences that are not requested by the subscriber or user.
Statistics
The technical storage or access that is used exclusively for statistical purposes.The technical storage or access that is used exclusively for anonymous statistical purposes. Without a subpoena, voluntary compliance on the part of your Internet Service Provider, or additional records from a third party, information stored or retrieved for this purpose alone cannot usually be used to identify you.
Marketing
The technical storage or access is required to create user profiles to send advertising, or to track the user on a website or across several websites for similar marketing purposes.